FACT 1
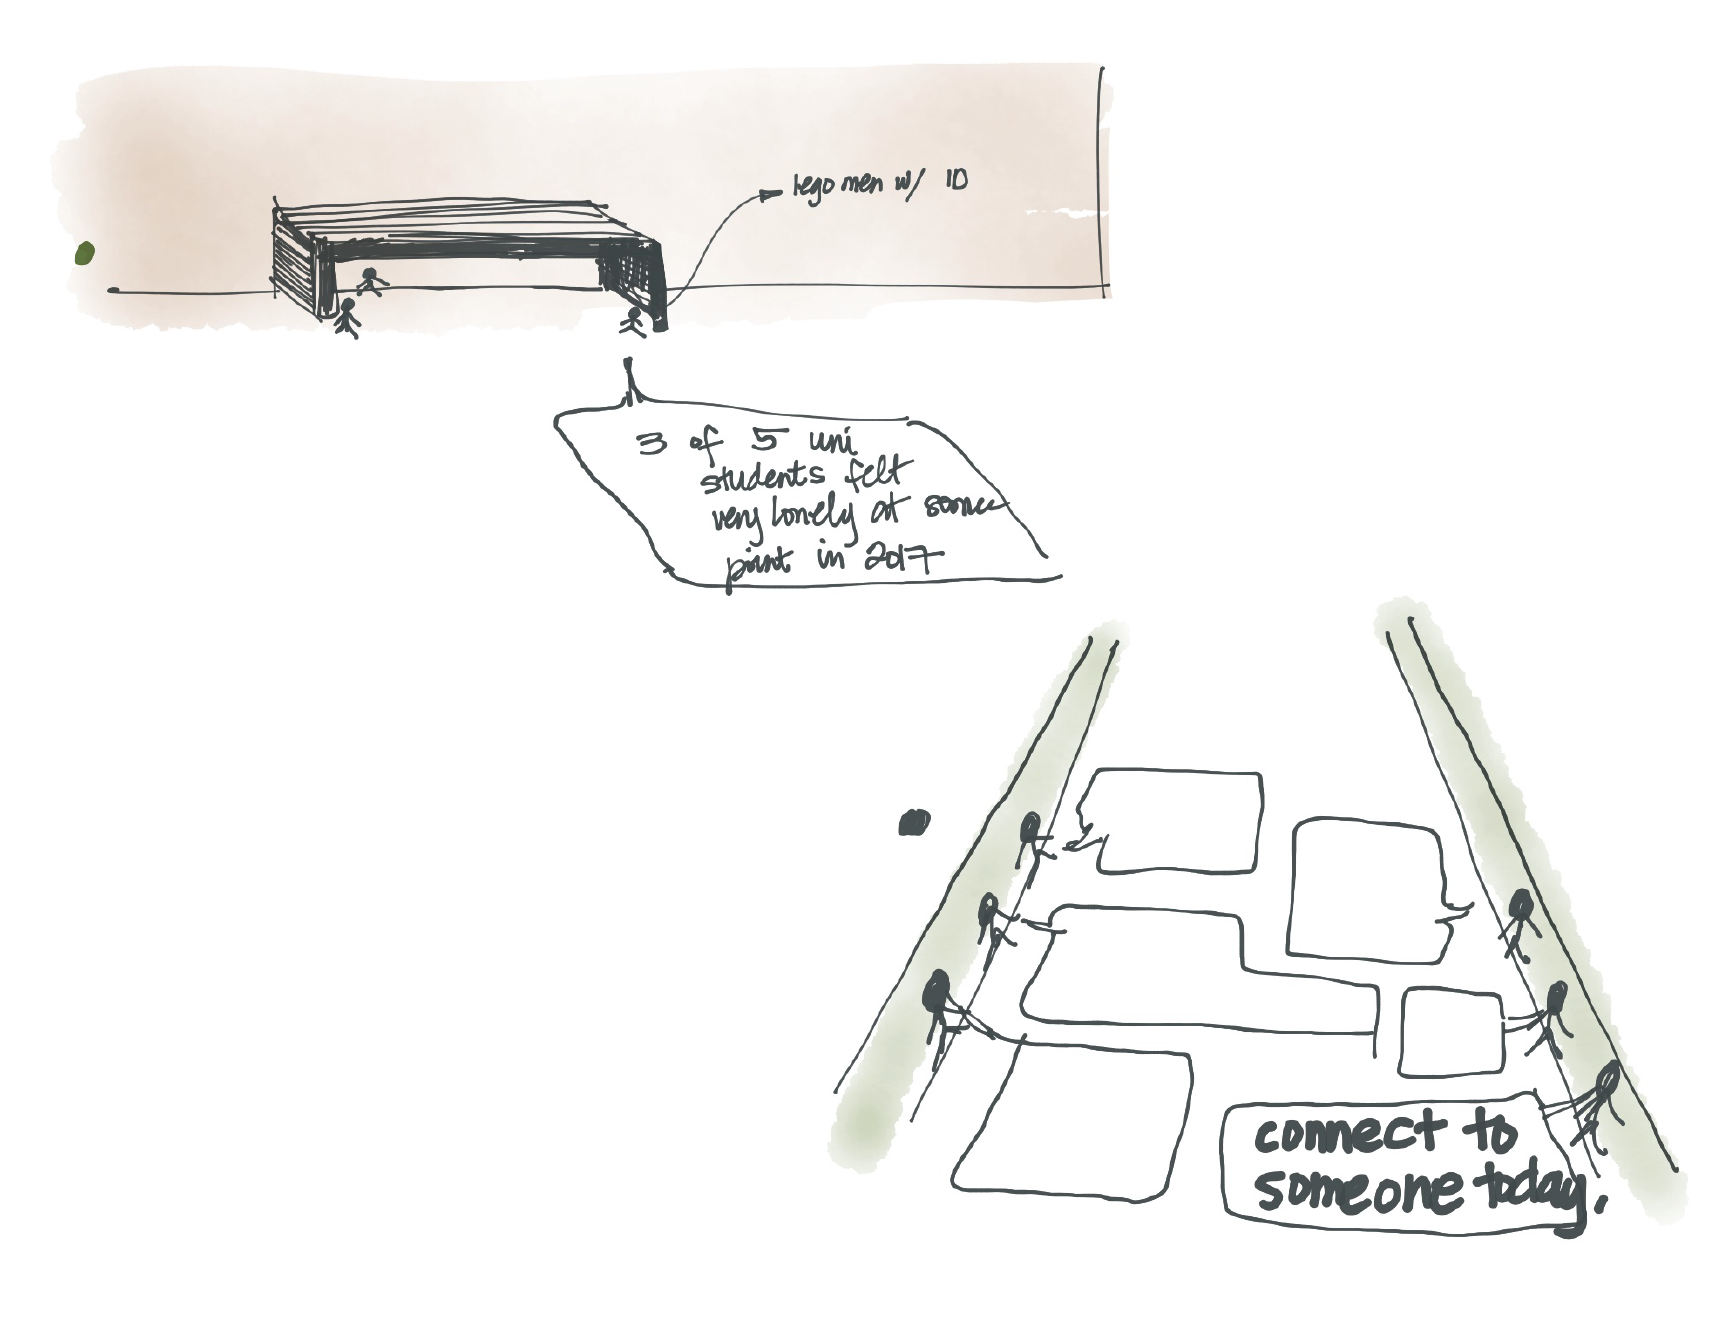
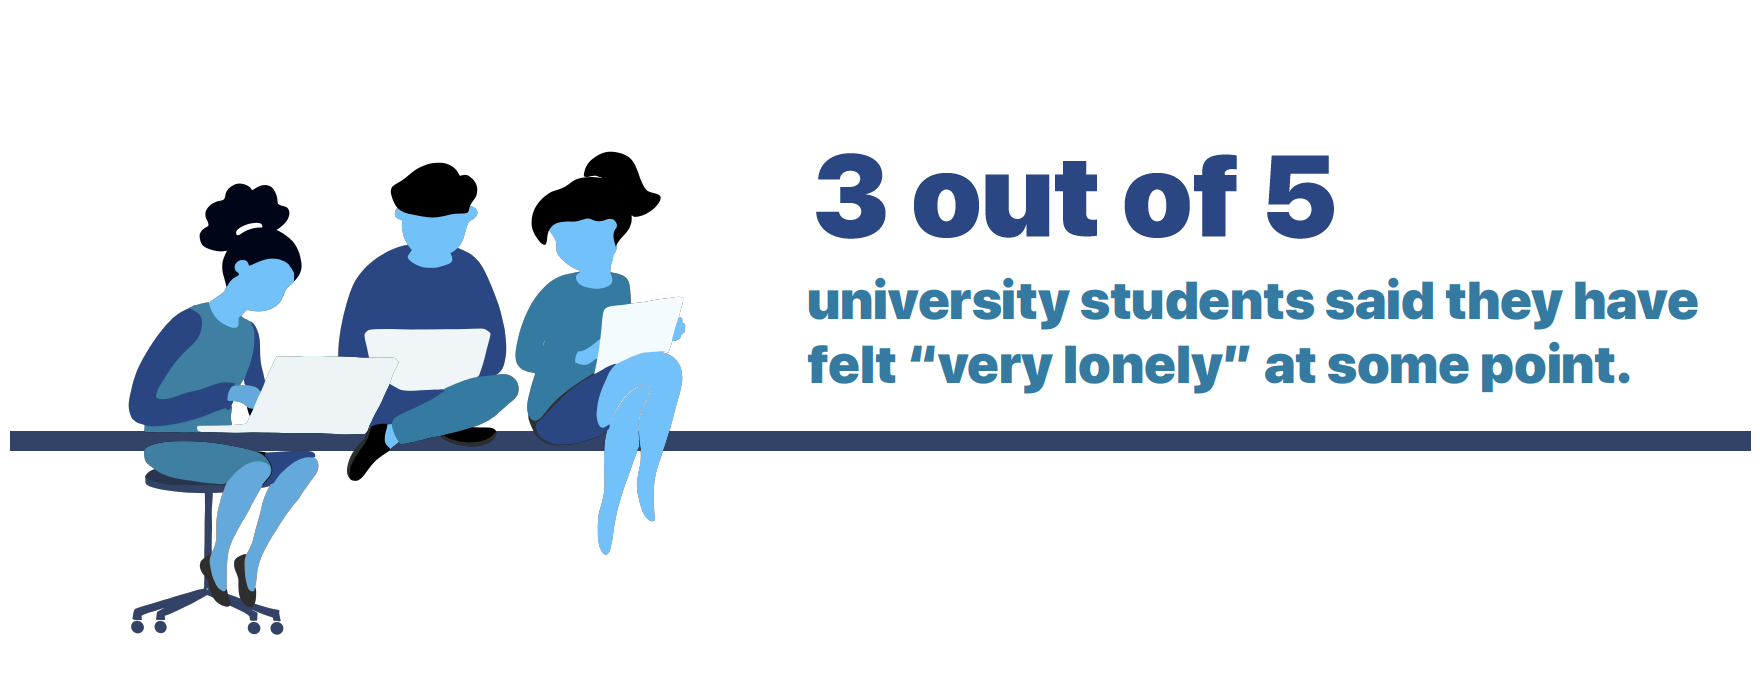
Three out of five university students said they have felt "very lonely" at some point.
In a 2017 survey of nearly 48,000 university students, 64% said they had felt “very lonely” in the previous 12 months. Students also reported feeling “overwhelming anxiety (62%) or “very sad” (69%), and that “things were hopeless” (53%).
Source: artandhealing.org
FACT 2
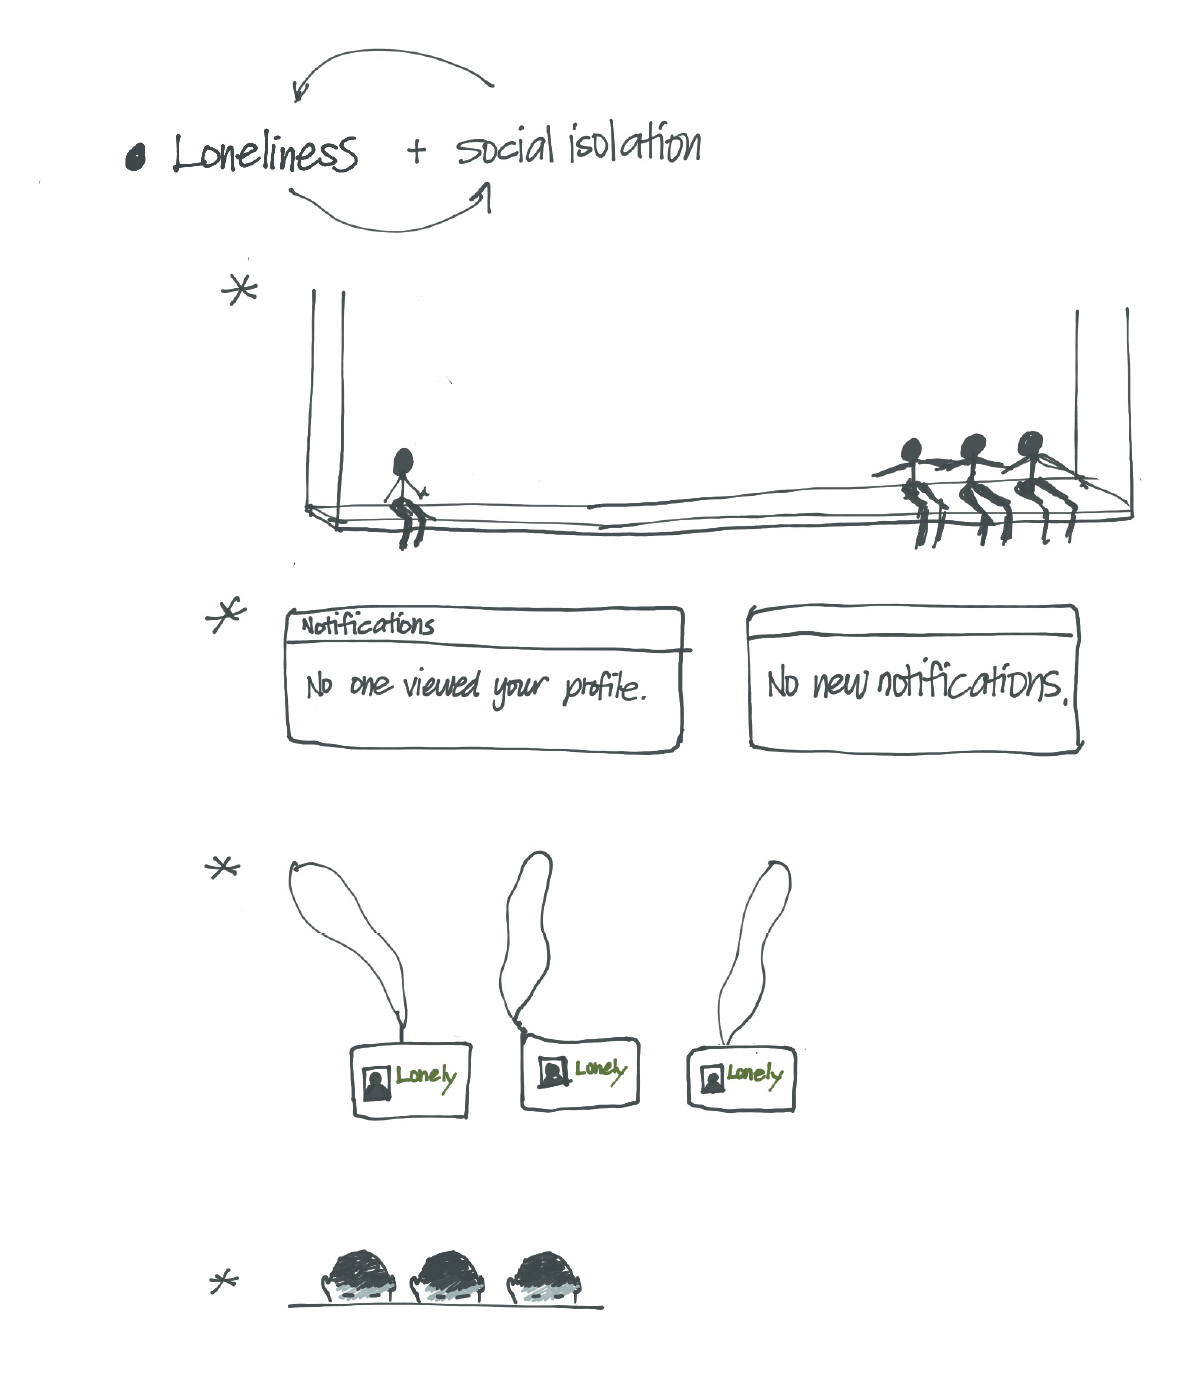
Loneliness exists but is not always obvious
Students can belong to a group, hang out, and continue on their daily lives without showing loneliness. Loneliness is not easily detectable.
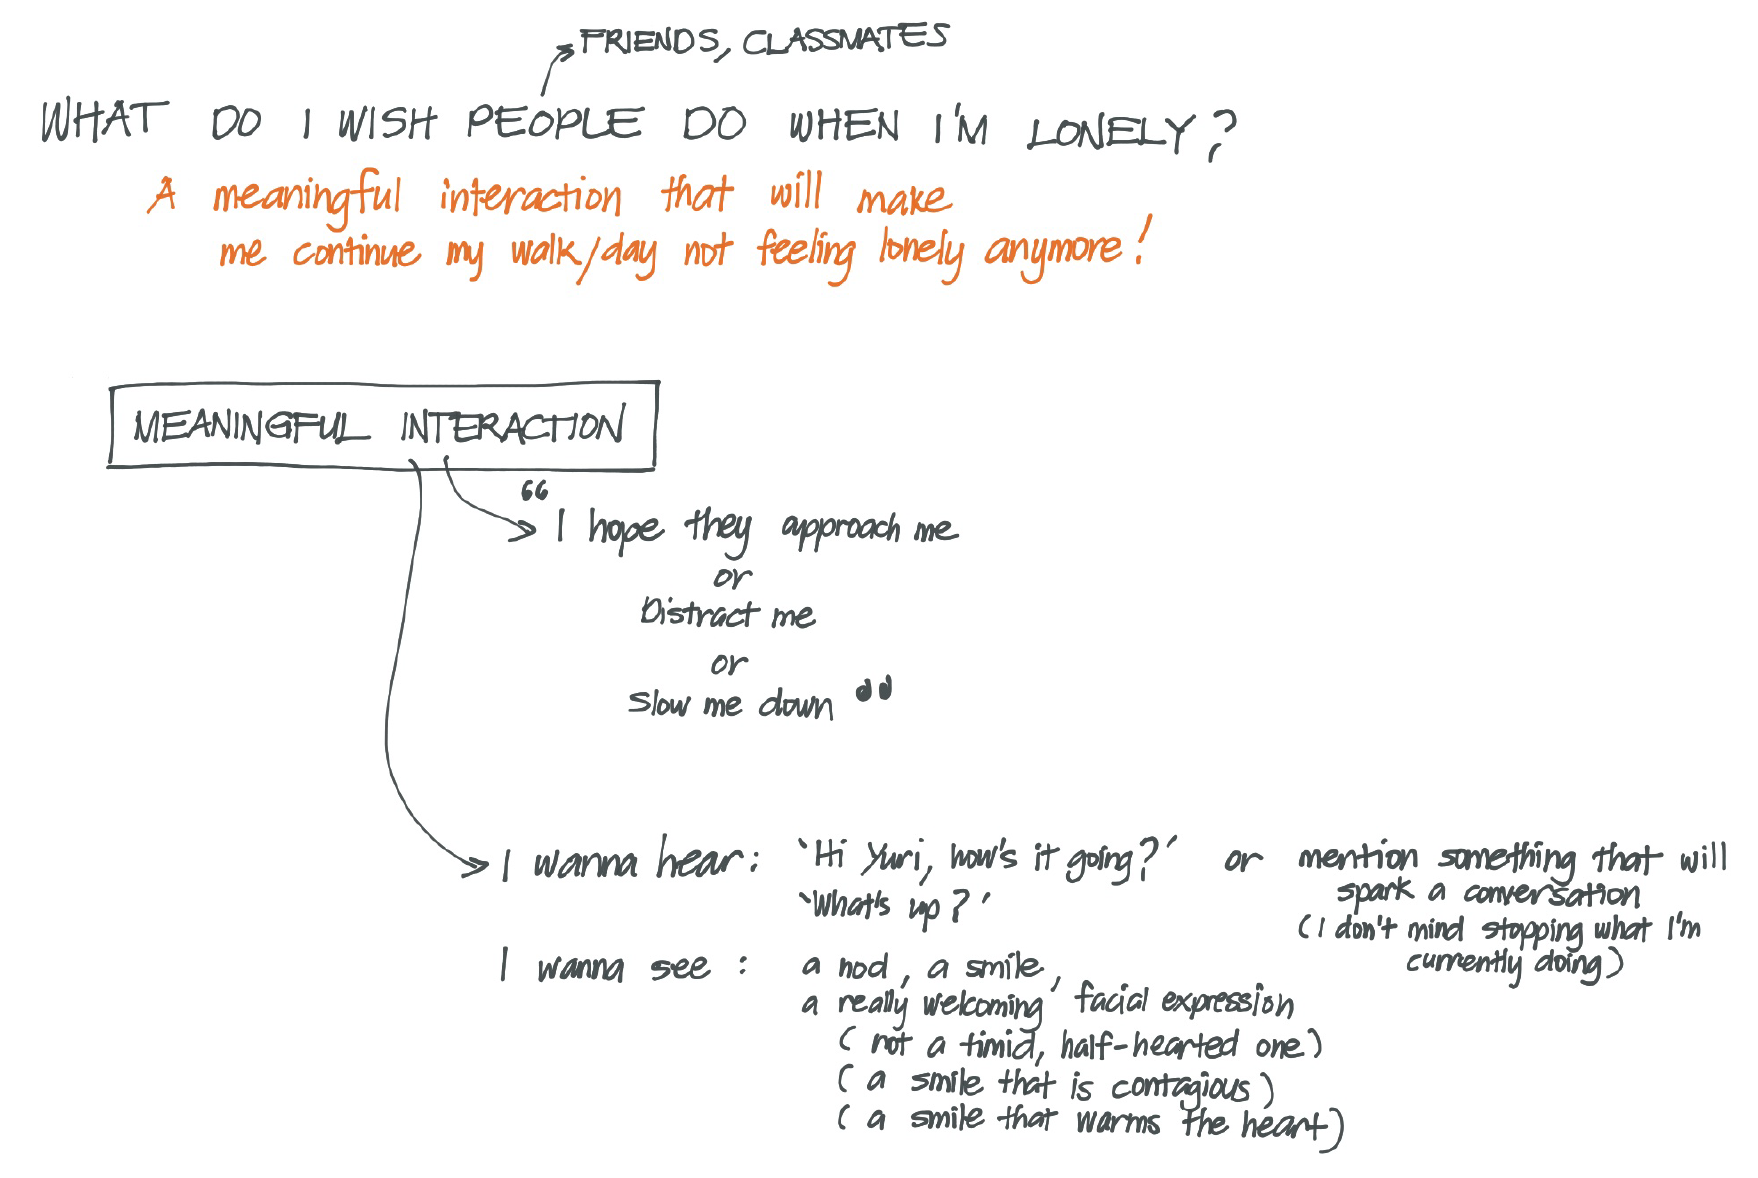
SO WHAT DO I WANT TO HAPPEN?
I want to encourage the viewers to reach out to their friends, daily.
I have considered myself a student experiencing loneliness every now and then even outside campus. To me, one effective way to help lonely students is by distracting them from their melancholic thoughts. We can reach out to them by engaging them in conversations.
STRATEGY
Visualizing the data
To emphasize the focus of the statistics which is the 3 out of 5, I placed the three lonely students close to each other, and at the same time close to the number 3. I also set the text in blue so that the three lonely students and the statistics about them correspond to each other well.
STRATEGY
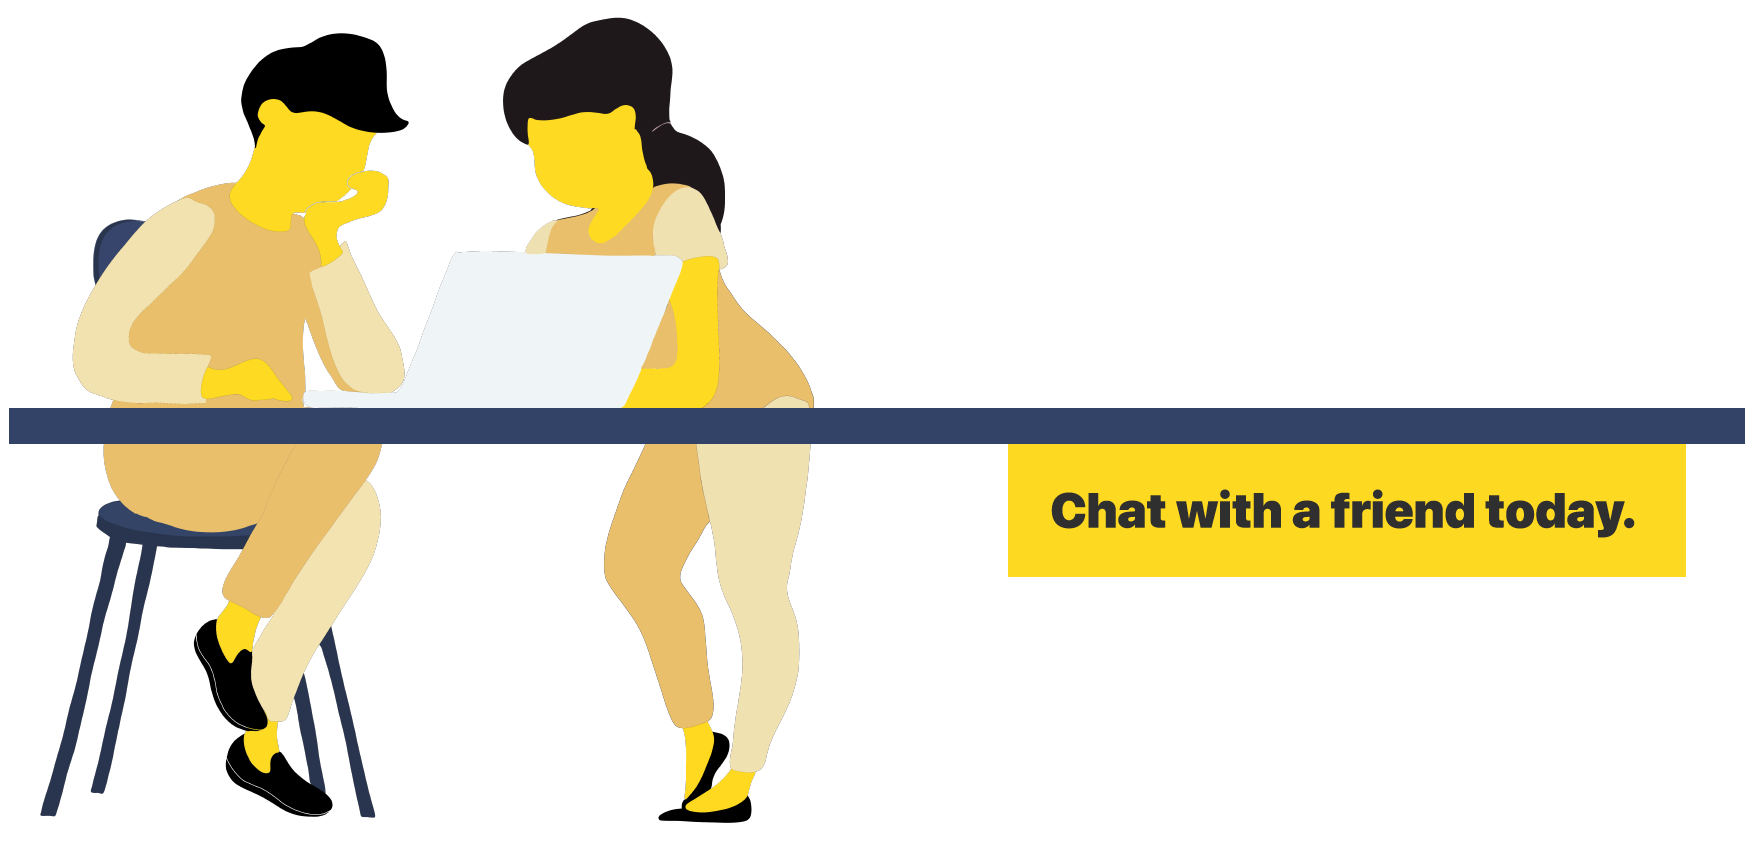
Emphasizing audience response
I matched the colours of the two happy students with the background of ‘Chat with a friend today’ so that the audience can understand that chatting with a friend has a positive (and happy) result.
Some process works